What's wrong?
One of the most important skills to learn
Learning to problem solve and debug your code is probably one of the best skills you can have as a developer. It's an art and a craft that takes time to learn. You won't be an expert after this class, but you can get a good start. Throwing up your hands and declaring "my program doesn't work" won't get you very far. Use the Trouble shooting and getting help guide as a road map for helping to solve problems on your own. And when you can't, then it's time to ask for help.
Developer Tools
Here's how we're going to try to debug our JavaScript programs.
The Issue
JavaScript is not very good about telling us something is wrong. Look at this demo to see what I mean.
Demo
- Demo: What's Wrong
- unit02/demos/demo-devTools.html
Launching Developer Tools
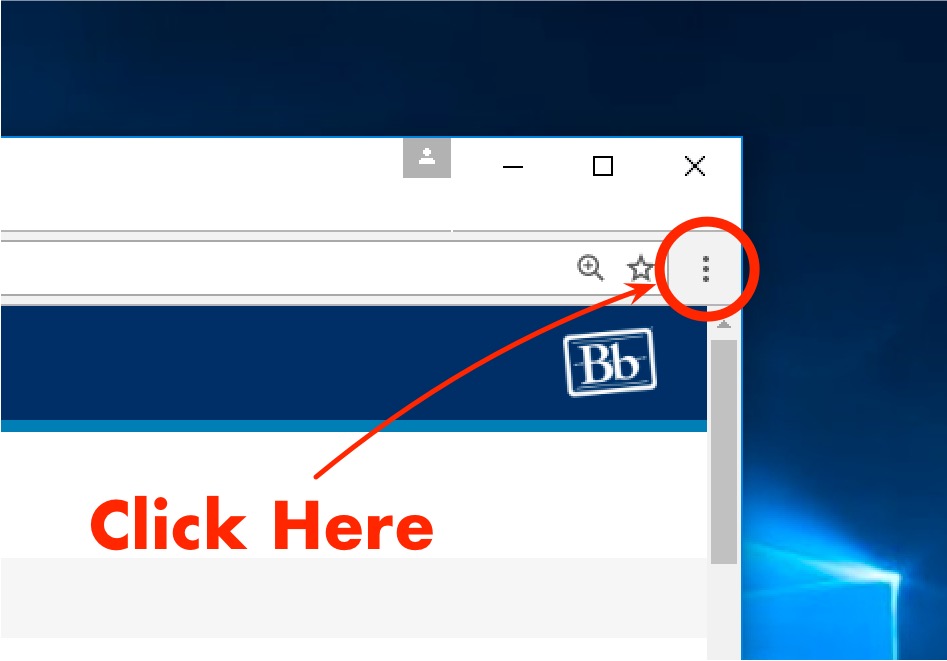
Open Chrome and click on the Customize and control button in the upper right-hand corner.
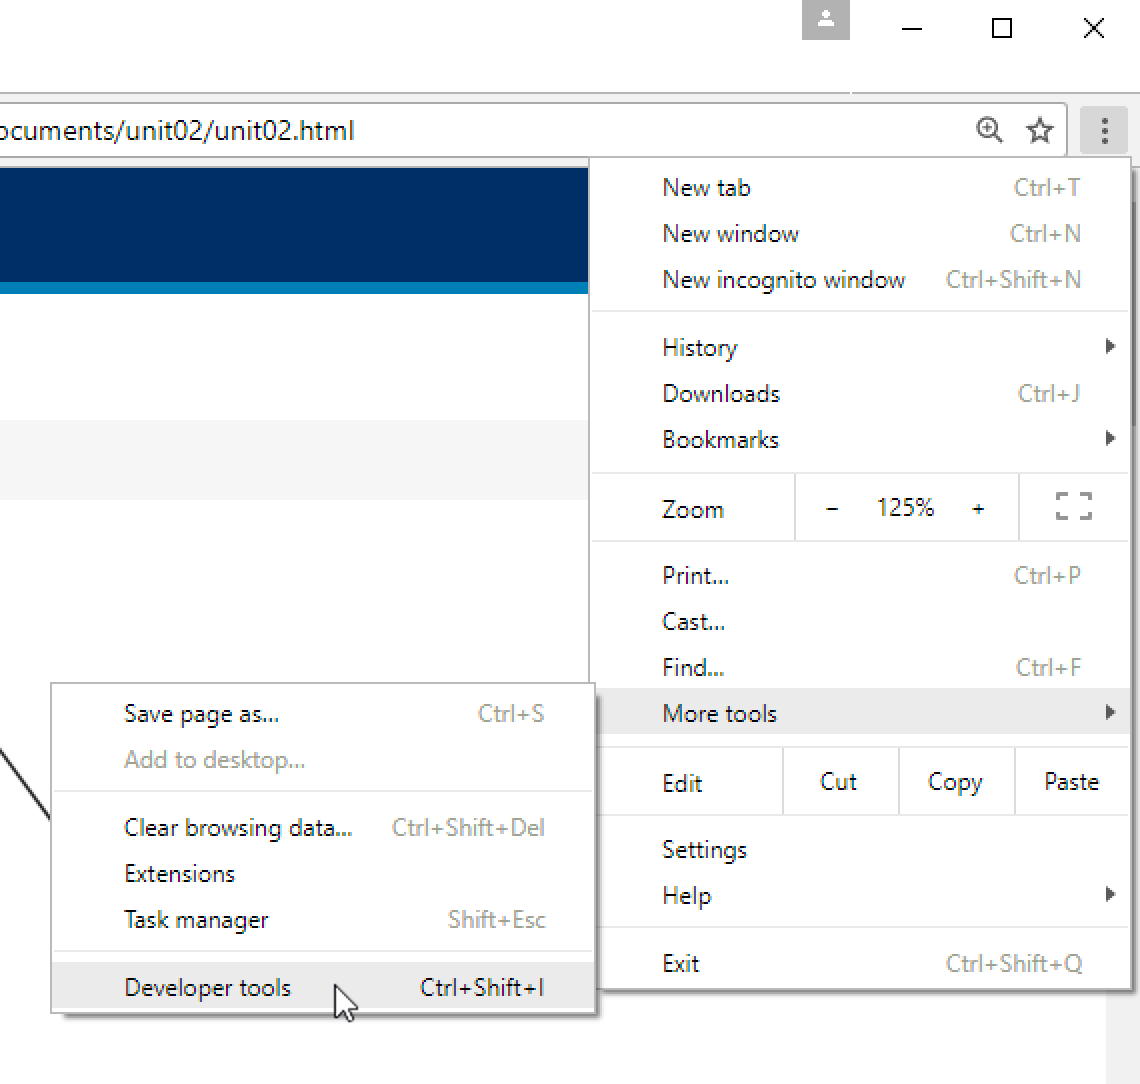
Select the More tools->Developer tools menu item. You can also press Control+Shift+I or F12.
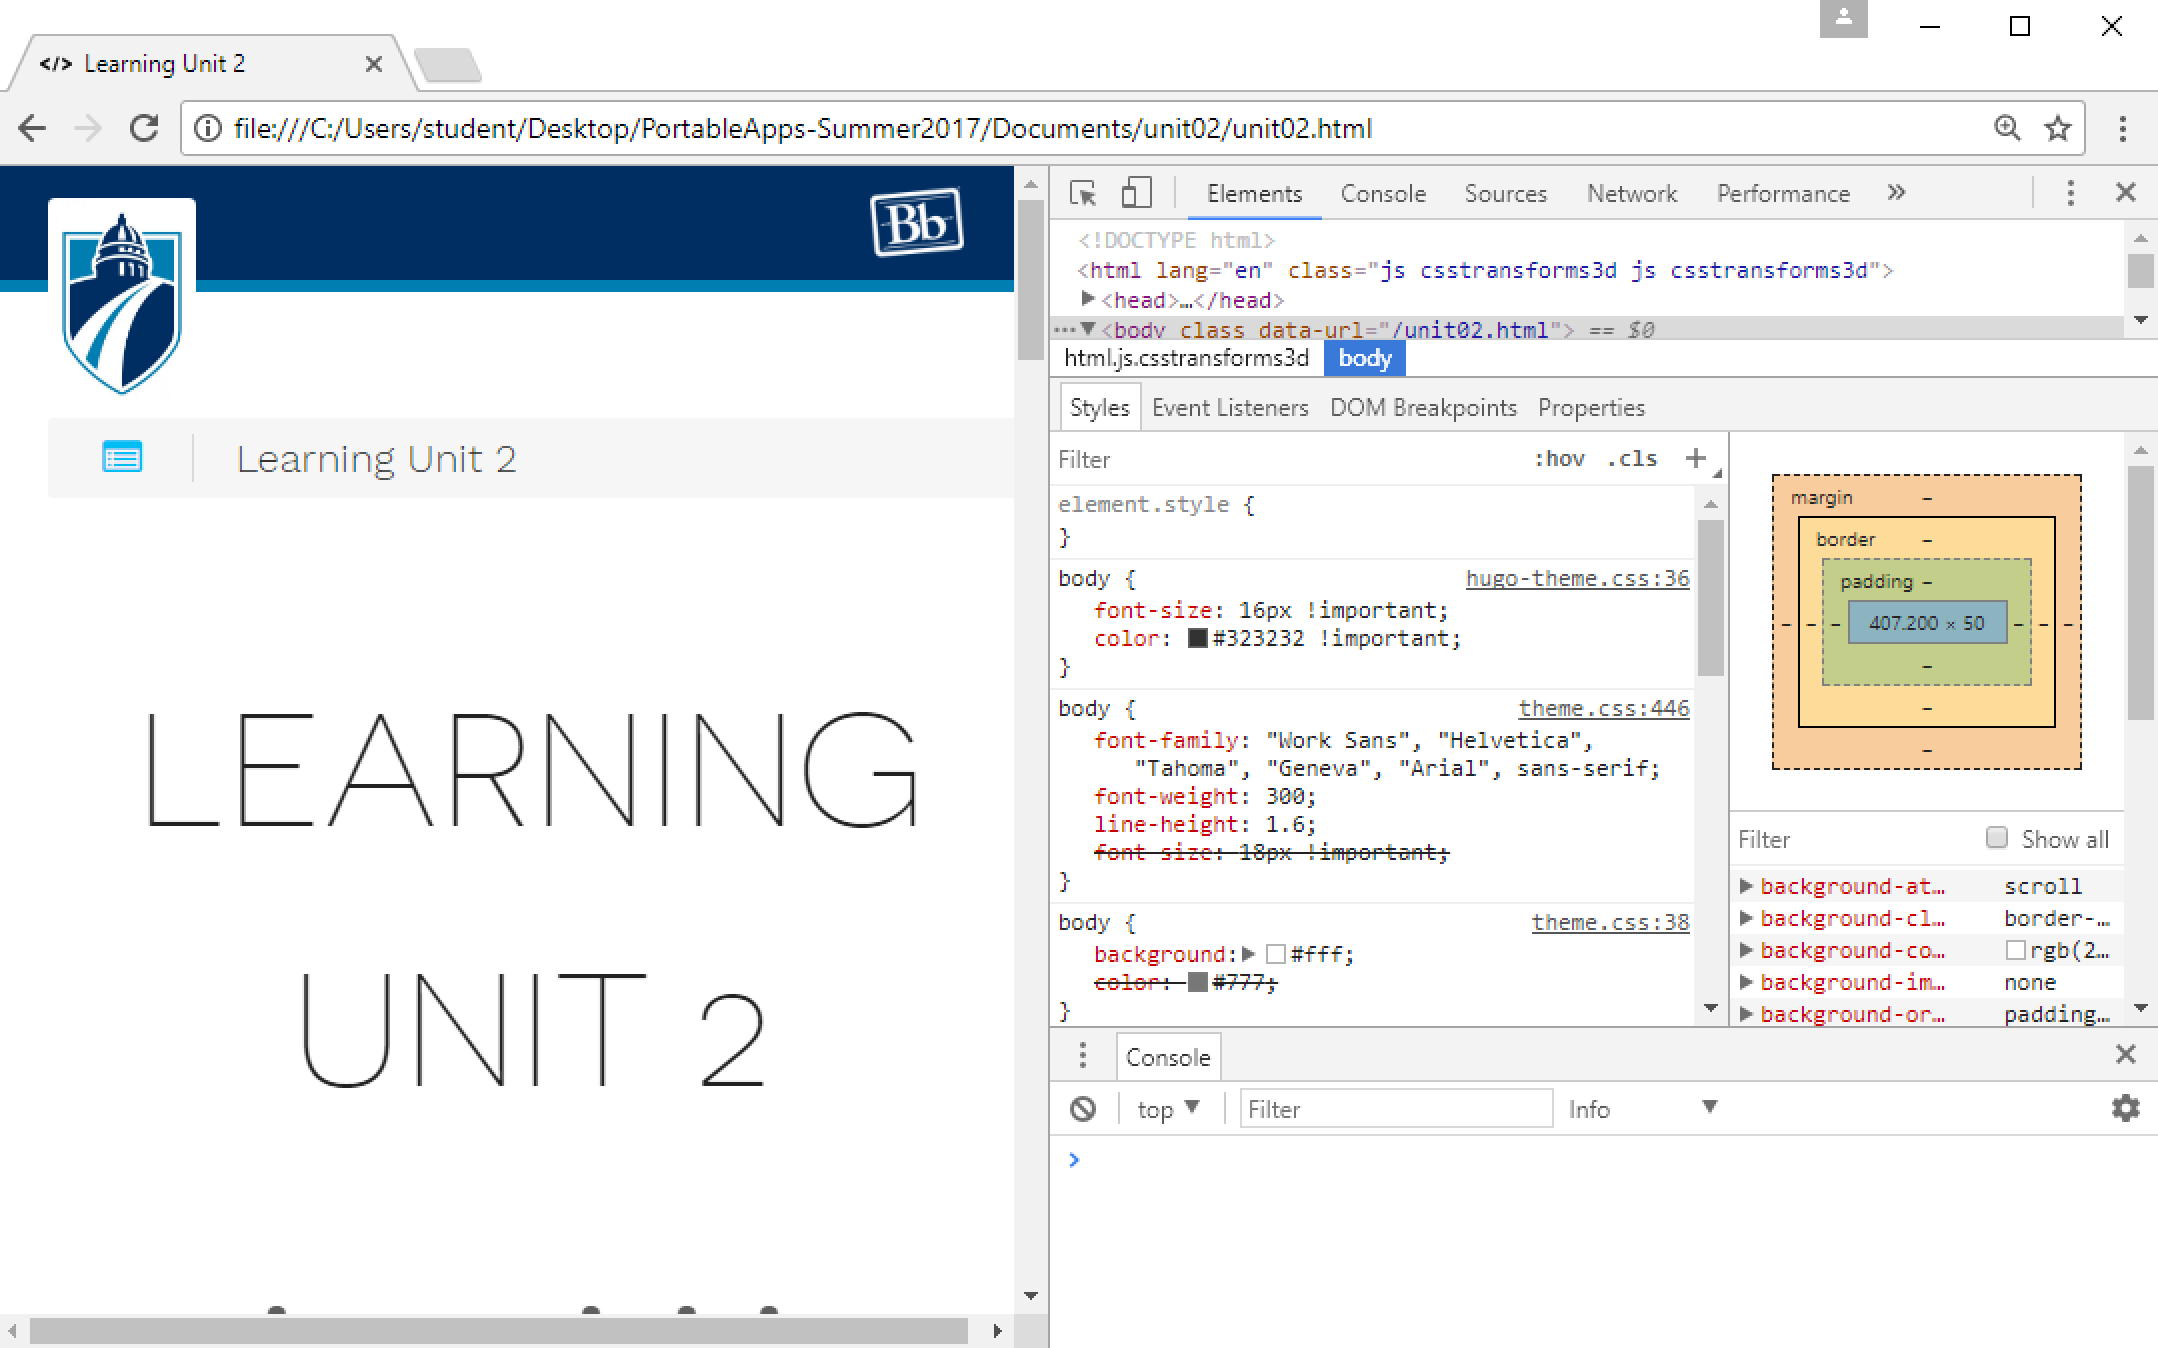
This will launch the Developers Tools built into the Chrome browser. Most likely, it will look something like this.
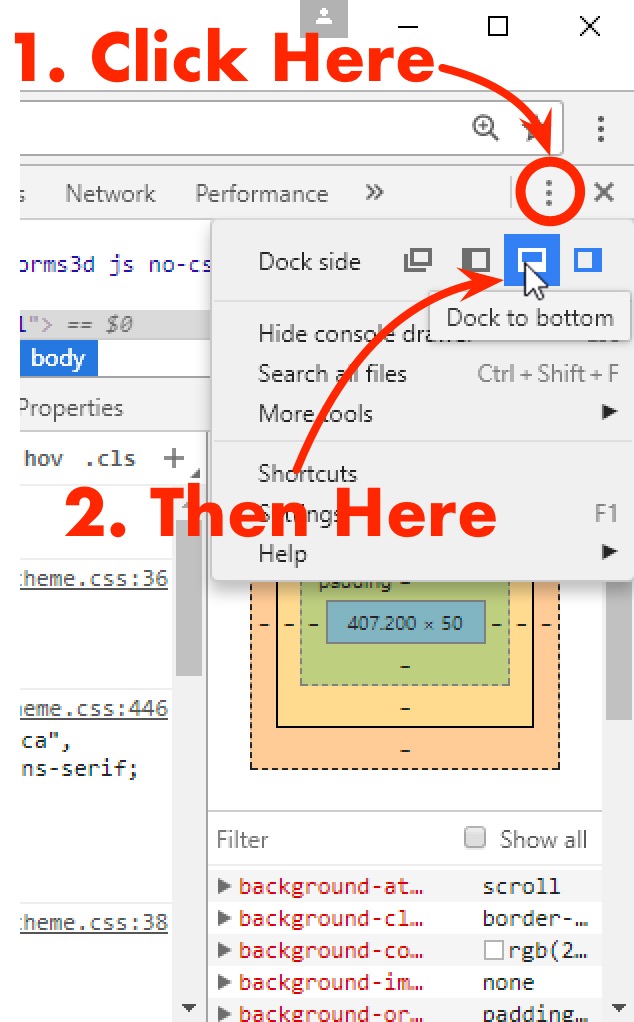
That is not a great format for projecting or working with it on small monitors. Let's fix that by putting the Developers tools window at the bottom. Click on the menu in the screenshot and select the Dock to bottom. You could also choose the first icon which will put the tools in a separate window. That might work well on a big monitor or with dual monitors. I'll always use it on the bottom of the window for class.
Here it is with the tools on the bottom.
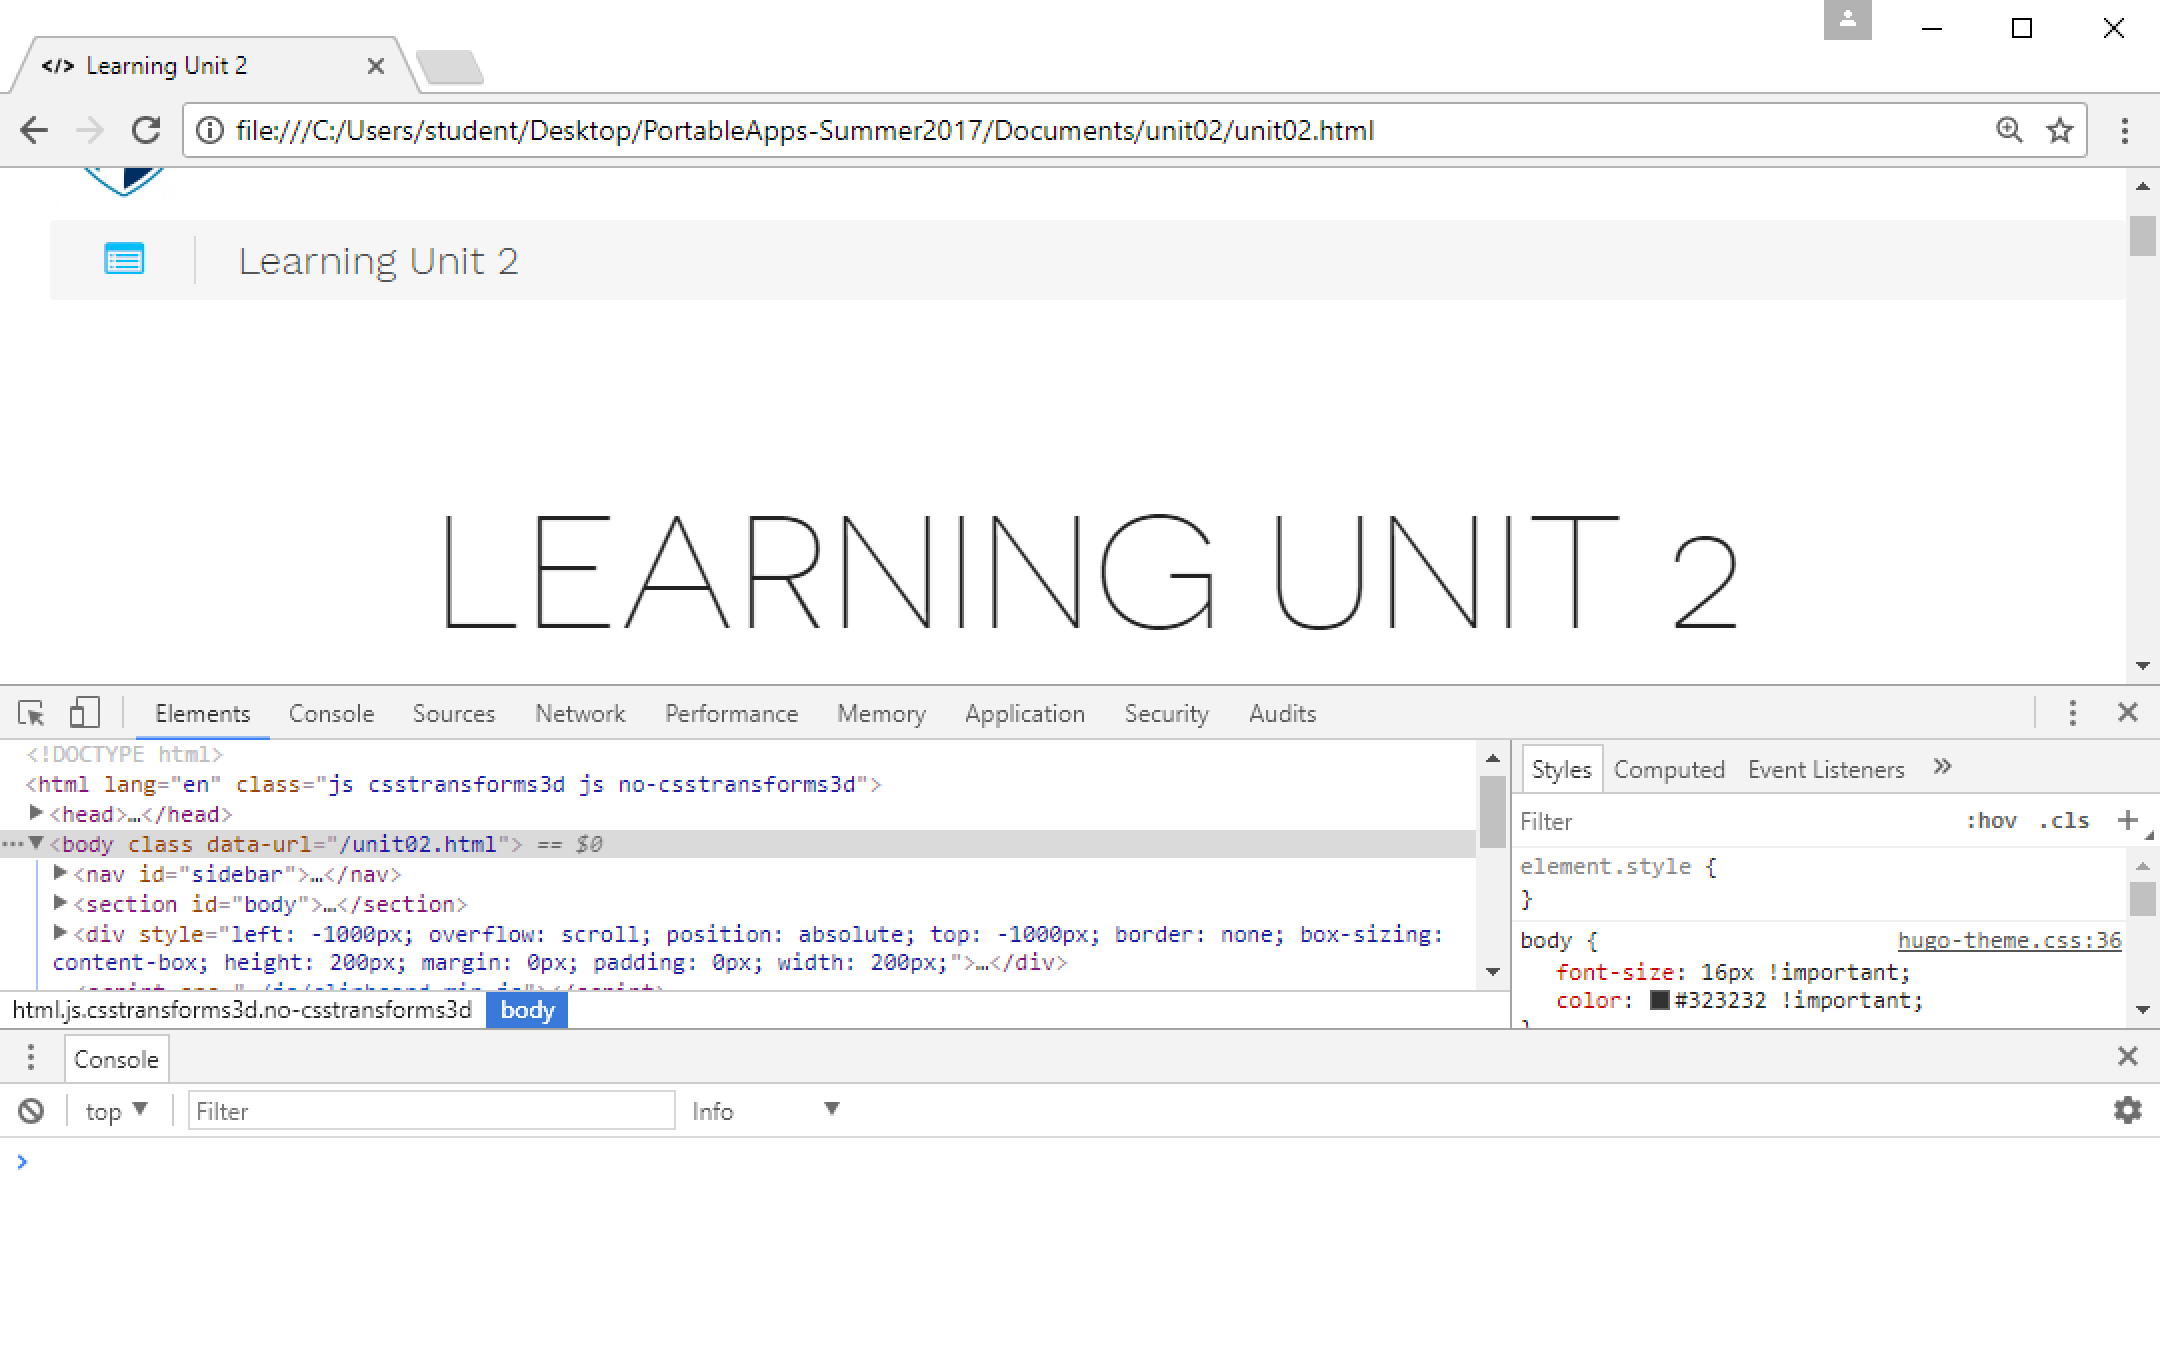
What is this?
The Developer Tools are a suite of tools built right into Chrome that help developers fix issues and get things work properly. They can help with css, html, networking, security, and debugging JavaScript. Let's take a quick look at it.
⏰...
OK, we're back. Now let's open that same demo again, this time with the tools showing.
Demo
- Demo: What's Wrong
- unit02/demos/demo-devTools.html
Pausing on purpose: debugger;
With the tools open, refresh the page. It does not run. It stops, and one line is highlighted.
That's this, the first line inside usingDevTools() in demo-devTools.js:
1 | |
That one word is a breakpoint built into the language. With the Developer Tools open, JavaScript stops there and waits for you. With the tools closed it does nothing at all, so it is safe to leave in place while you are working.
While the page is paused you can:
- step through one line at a time with the Step over button
- hover over any variable to see what it holds right now
- watch
testinggo fromundefined, to5, to13
That is the difference between guessing what your code did and watching it happen.
Take it back out
A debugger; left in finished code will stop the program for anyone who has the Developer Tools
open. Delete it before you submit your work.
Chrome knew all along
Keep stepping, or press the blue Resume button to let the rest run. It does not get far. Look at the Console tab.

There it is, in red:
- Uncaught ReferenceError: mcPrin is not defined
Chrome knew what was wrong the whole time. We weren't listening. Now we are.
Read an error message in three pieces:
ReferenceError— the kind of problem. JavaScript was asked for a name it has never heard of.mcPrin is not defined— the name it couldn't find. There's our typo. It should bemcPrint.- the file and line number, on the right and again in the lines underneath. Click either one and Chrome jumps straight to the offending line.
Fix the typo in VS Code, save, and refresh. The error disappears and the Sample Output shows up.
Hands on work
Now it's your turn to do it. (Or do it again.)
Labs
- Developer Tools
- unit02/labs/lab-01-developerTools.html
- More Debugging
- unit02/labs/lab-02-debugging.html
Read more
Related Reading
Pages 123 - 134 — The book mentions click events a bit in here. We'll talk about those in Unit 5. For now just focus on the console and using it to debug your application. Pages 397 - 416 — Chapter 35 is all about using the developer tools baked into your browser. Some of it is beyond the scope of what we'll cover in this class, but it's great to familiarize yourself with these tools as early on in your education as possible. For this class, the ability to step through your code, demonstrated on pages 405 - 411 is particularly useful. 411 - 416 is more on what we discussed on this page.